We have a highly manual processes within our company we are trying to automate. We have very large excel spreadsheets that contain vendor details. E.g. their location, services they provide (e.g. diggers, trucks etc), and their different rates for weekday, night, Saturday, Sunday and public holidays.
Our people on site engage with this spreadsheet daily to see what contractor is best for the job, but it is incredibly complex, and difficult to navigate especially on a phone / tablet which is often used on site. We want to improve this by ingesting all of this information into a document that Synap can surface to the people on site. This means they will interact with the bot and say "I am in the Dunedin region and I need to hire a truck with driver, that offers a 6 wheel tripper on a Monday" - Give me the rates of people who provide this, and then provide me the cheapest contractor who provides this service"
Our CSM has kindly suggested that the bot doesn't read well from tabularised information (the info is currently stored in a spreadsheet), and has surfaced some indexing and heading for better writing for the bot. I was wondering if it was necessary to implement any advanced configurations / workflows for this to improve its performance. Currently, I am reformatting the excel spreadsheet data into heading and indexable information.
If I choose to go ahead with heading the information, there will be over 3500 headings / contractors to index over. Will this be too many and hinder performance? Are there any other alternative approaches we can build out this solution in
An important note is that this information is highly confidential, so if we use Synap, space permissions must be applied so only users who have access to the space will be able to access this content via the bot.
Thanks, and look forward to hearing from you. Fergus
Best answer by alee
Hi Fergus,
Great question! If your data is stored in an Excel on sharepoint you can integrate it with your AI Assistant via the ms graph API. Then you will be able to ask the AI Assistant to retrieve answers from it as per your example in your post.
Prerequisites
Need msgraph file read permissions for target files
Need msgraph folder permissions for target files
Excel needs data formatted as a table
The Ground Work
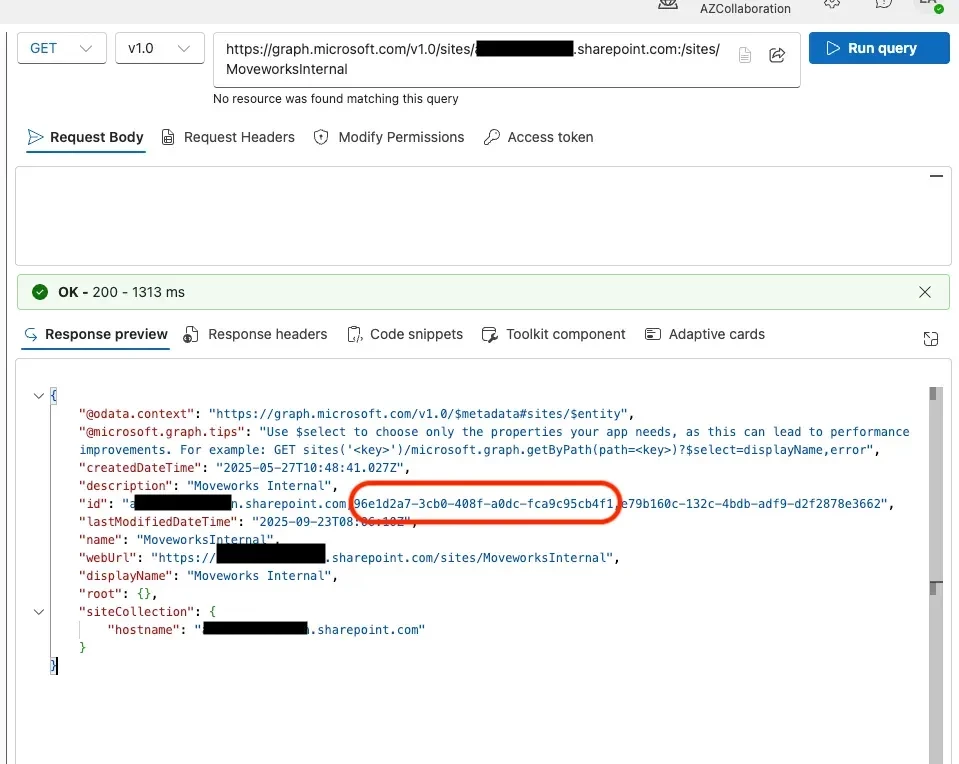
Get the sharepoint site ID
If you don’t already have this you can use API Playground or Microsoft Graph Explorer and run the following query. Graph Explorer can be useful if you are missing permissions in ms graph to do the queries to get the site and table ID.
In the id attribute you will get a few comma separated values, you want to take the first value that looks like an id (see red box). This is the sharepoint site’s id.
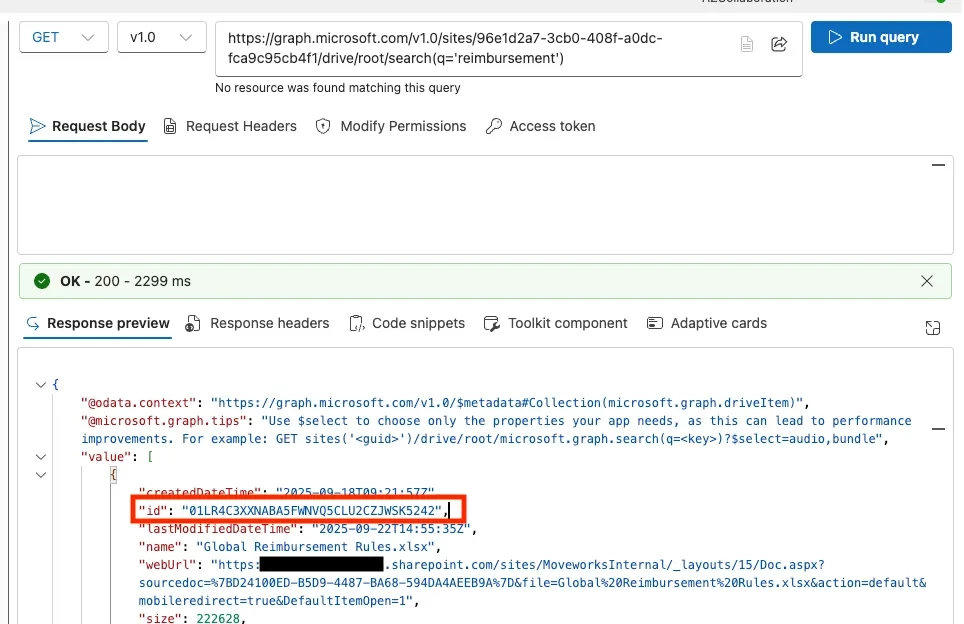
Get the spreadsheet ID
Now we get the spreadsheet ID with the following call:
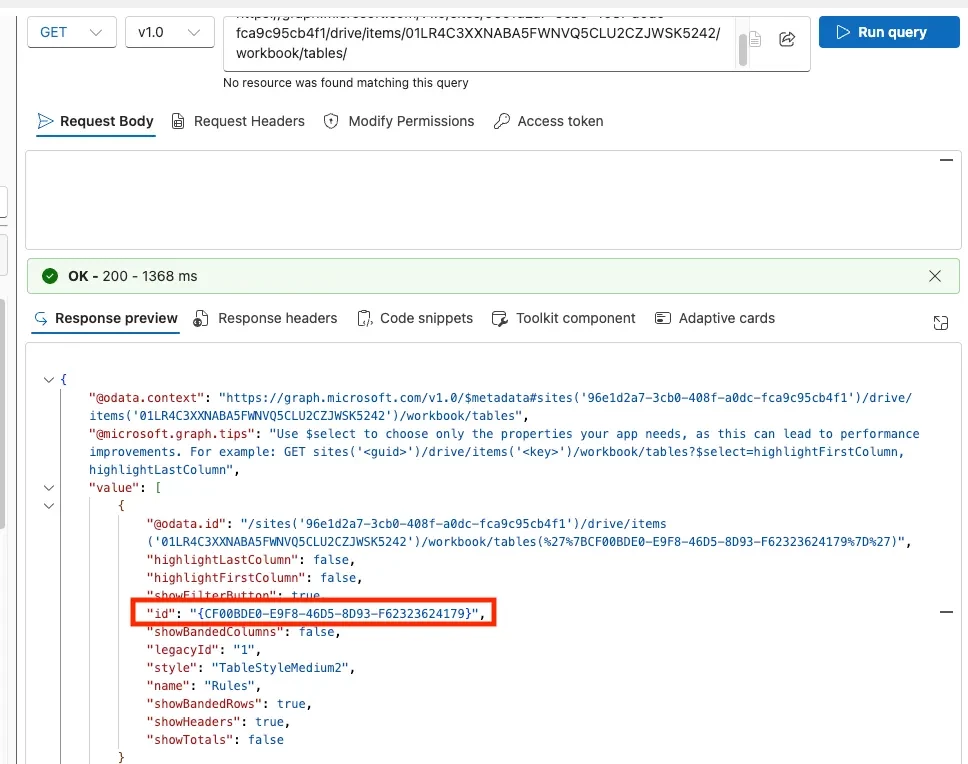
Now you should have the spreadsheet id and table id you can go into Agent Studio to start building!
Agent Studio Build
The use case detailed below, connects to a specified spreadsheet table, filters the data based on inputs gathered by the AI Assistant then returns the results back.
It is also possible to write data to the Excel spreadsheet but we will not explore that in this use case.
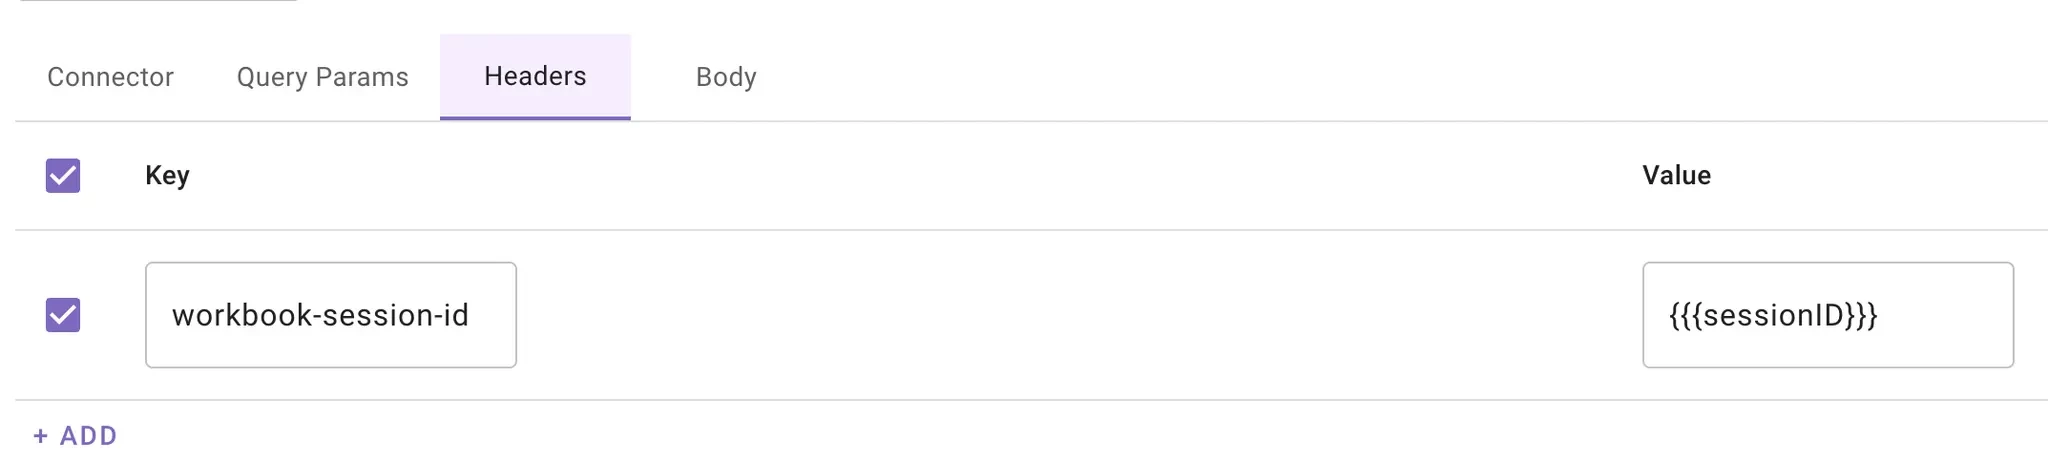
Create Session - Create a workbook session on the target file and capture the workbook-session-id from the response. Include this header on every subsequent request so all operations run in the same in-memory context. persistChanges: false in the body as we don’t want any changes to the spreadsheet to persist
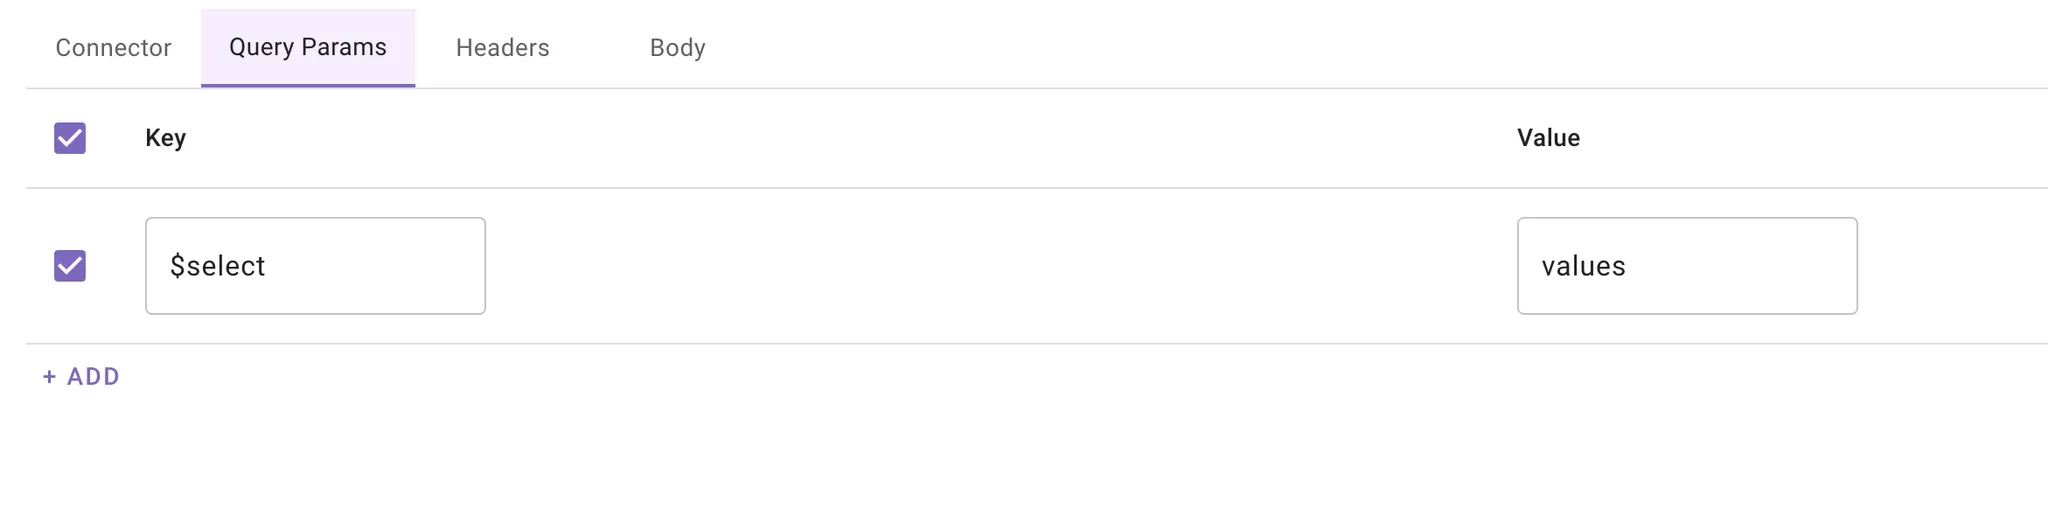
Apply Filters - target the relevant worksheet or table and apply filter criteria (e.g., by column values, text, number ranges, or dates). This step limits the workbook view to just the rows your app cares about while leaving the underlying data intact
Get Data - Query the filtered range/table to read only the visible rows produced by the active filters
Close Session - When finished, explicitly close the workbook session to release server resources
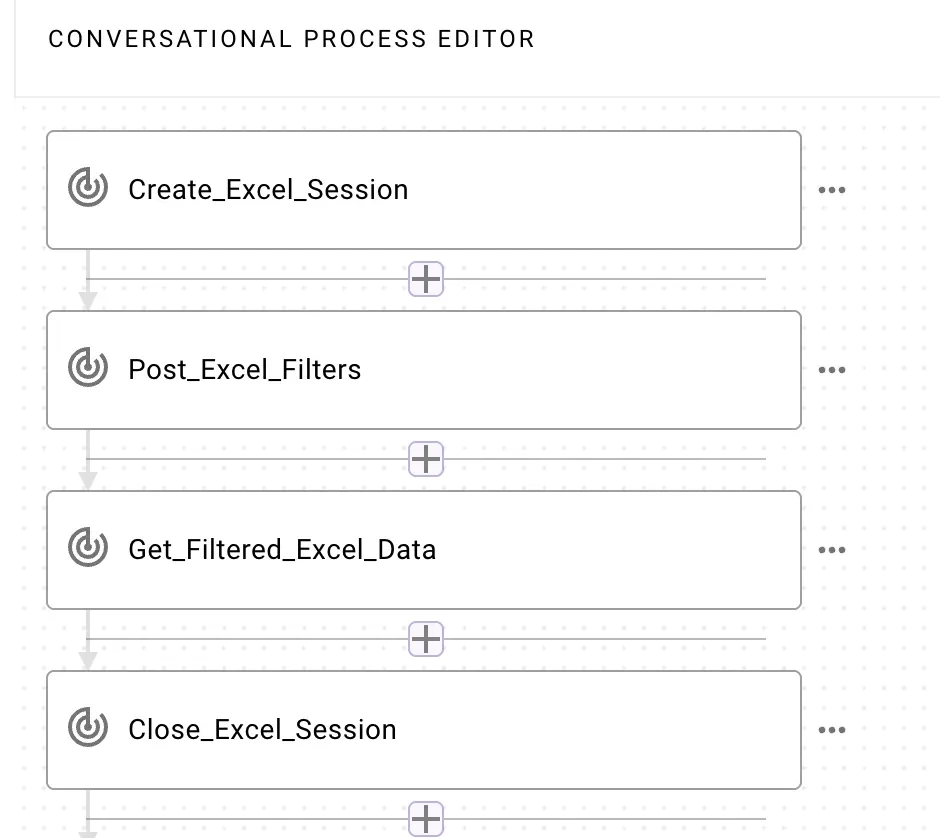
A basic version of this will look like the below, if you need to filter the table multiple times on different columns, you would have multiple Post_Excel_Filters actions, one for each column you would want to filter on.
!-->
Additional Notes and Limitations
You could initially try this without adding in the filter actions, so your AI Assistant would retrieve all the data in the Excel and use its reasoning to return only the relevant information the user requests. The downside of this approach is potential performance issues if the dataset is very big.
Keep the Excel formatted with no filters applied. If filters are applied and saved to the Excel then your AI Assistant will only have view of that data
This sounds like an interesting use case; I’d like to do something similar and look forward to what you may find. I’m an early-stage Moveworks user myself, still learning my way around.
Great question! If your data is stored in an Excel on sharepoint you can integrate it with your AI Assistant via the ms graph API. Then you will be able to ask the AI Assistant to retrieve answers from it as per your example in your post.
Prerequisites
Need msgraph file read permissions for target files
Need msgraph folder permissions for target files
Excel needs data formatted as a table
The Ground Work
Get the sharepoint site ID
If you don’t already have this you can use API Playground or Microsoft Graph Explorer and run the following query. Graph Explorer can be useful if you are missing permissions in ms graph to do the queries to get the site and table ID.
In the id attribute you will get a few comma separated values, you want to take the first value that looks like an id (see red box). This is the sharepoint site’s id.
Get the spreadsheet ID
Now we get the spreadsheet ID with the following call:
Now you should have the spreadsheet id and table id you can go into Agent Studio to start building!
Agent Studio Build
The use case detailed below, connects to a specified spreadsheet table, filters the data based on inputs gathered by the AI Assistant then returns the results back.
It is also possible to write data to the Excel spreadsheet but we will not explore that in this use case.
Create Session - Create a workbook session on the target file and capture the workbook-session-id from the response. Include this header on every subsequent request so all operations run in the same in-memory context. persistChanges: false in the body as we don’t want any changes to the spreadsheet to persist
Apply Filters - target the relevant worksheet or table and apply filter criteria (e.g., by column values, text, number ranges, or dates). This step limits the workbook view to just the rows your app cares about while leaving the underlying data intact
Get Data - Query the filtered range/table to read only the visible rows produced by the active filters
Close Session - When finished, explicitly close the workbook session to release server resources
A basic version of this will look like the below, if you need to filter the table multiple times on different columns, you would have multiple Post_Excel_Filters actions, one for each column you would want to filter on.
!-->
Additional Notes and Limitations
You could initially try this without adding in the filter actions, so your AI Assistant would retrieve all the data in the Excel and use its reasoning to return only the relevant information the user requests. The downside of this approach is potential performance issues if the dataset is very big.
Keep the Excel formatted with no filters applied. If filters are applied and saved to the Excel then your AI Assistant will only have view of that data
If you're a Moveworks customer, you can click the SSO button below to login-even if it's your first time. Everyone else can use email or click create an account above to register.
If you're a Moveworks customer, you can click the SSO button below to login-even if it's your first time. Everyone else can use email or click create an account above to register.